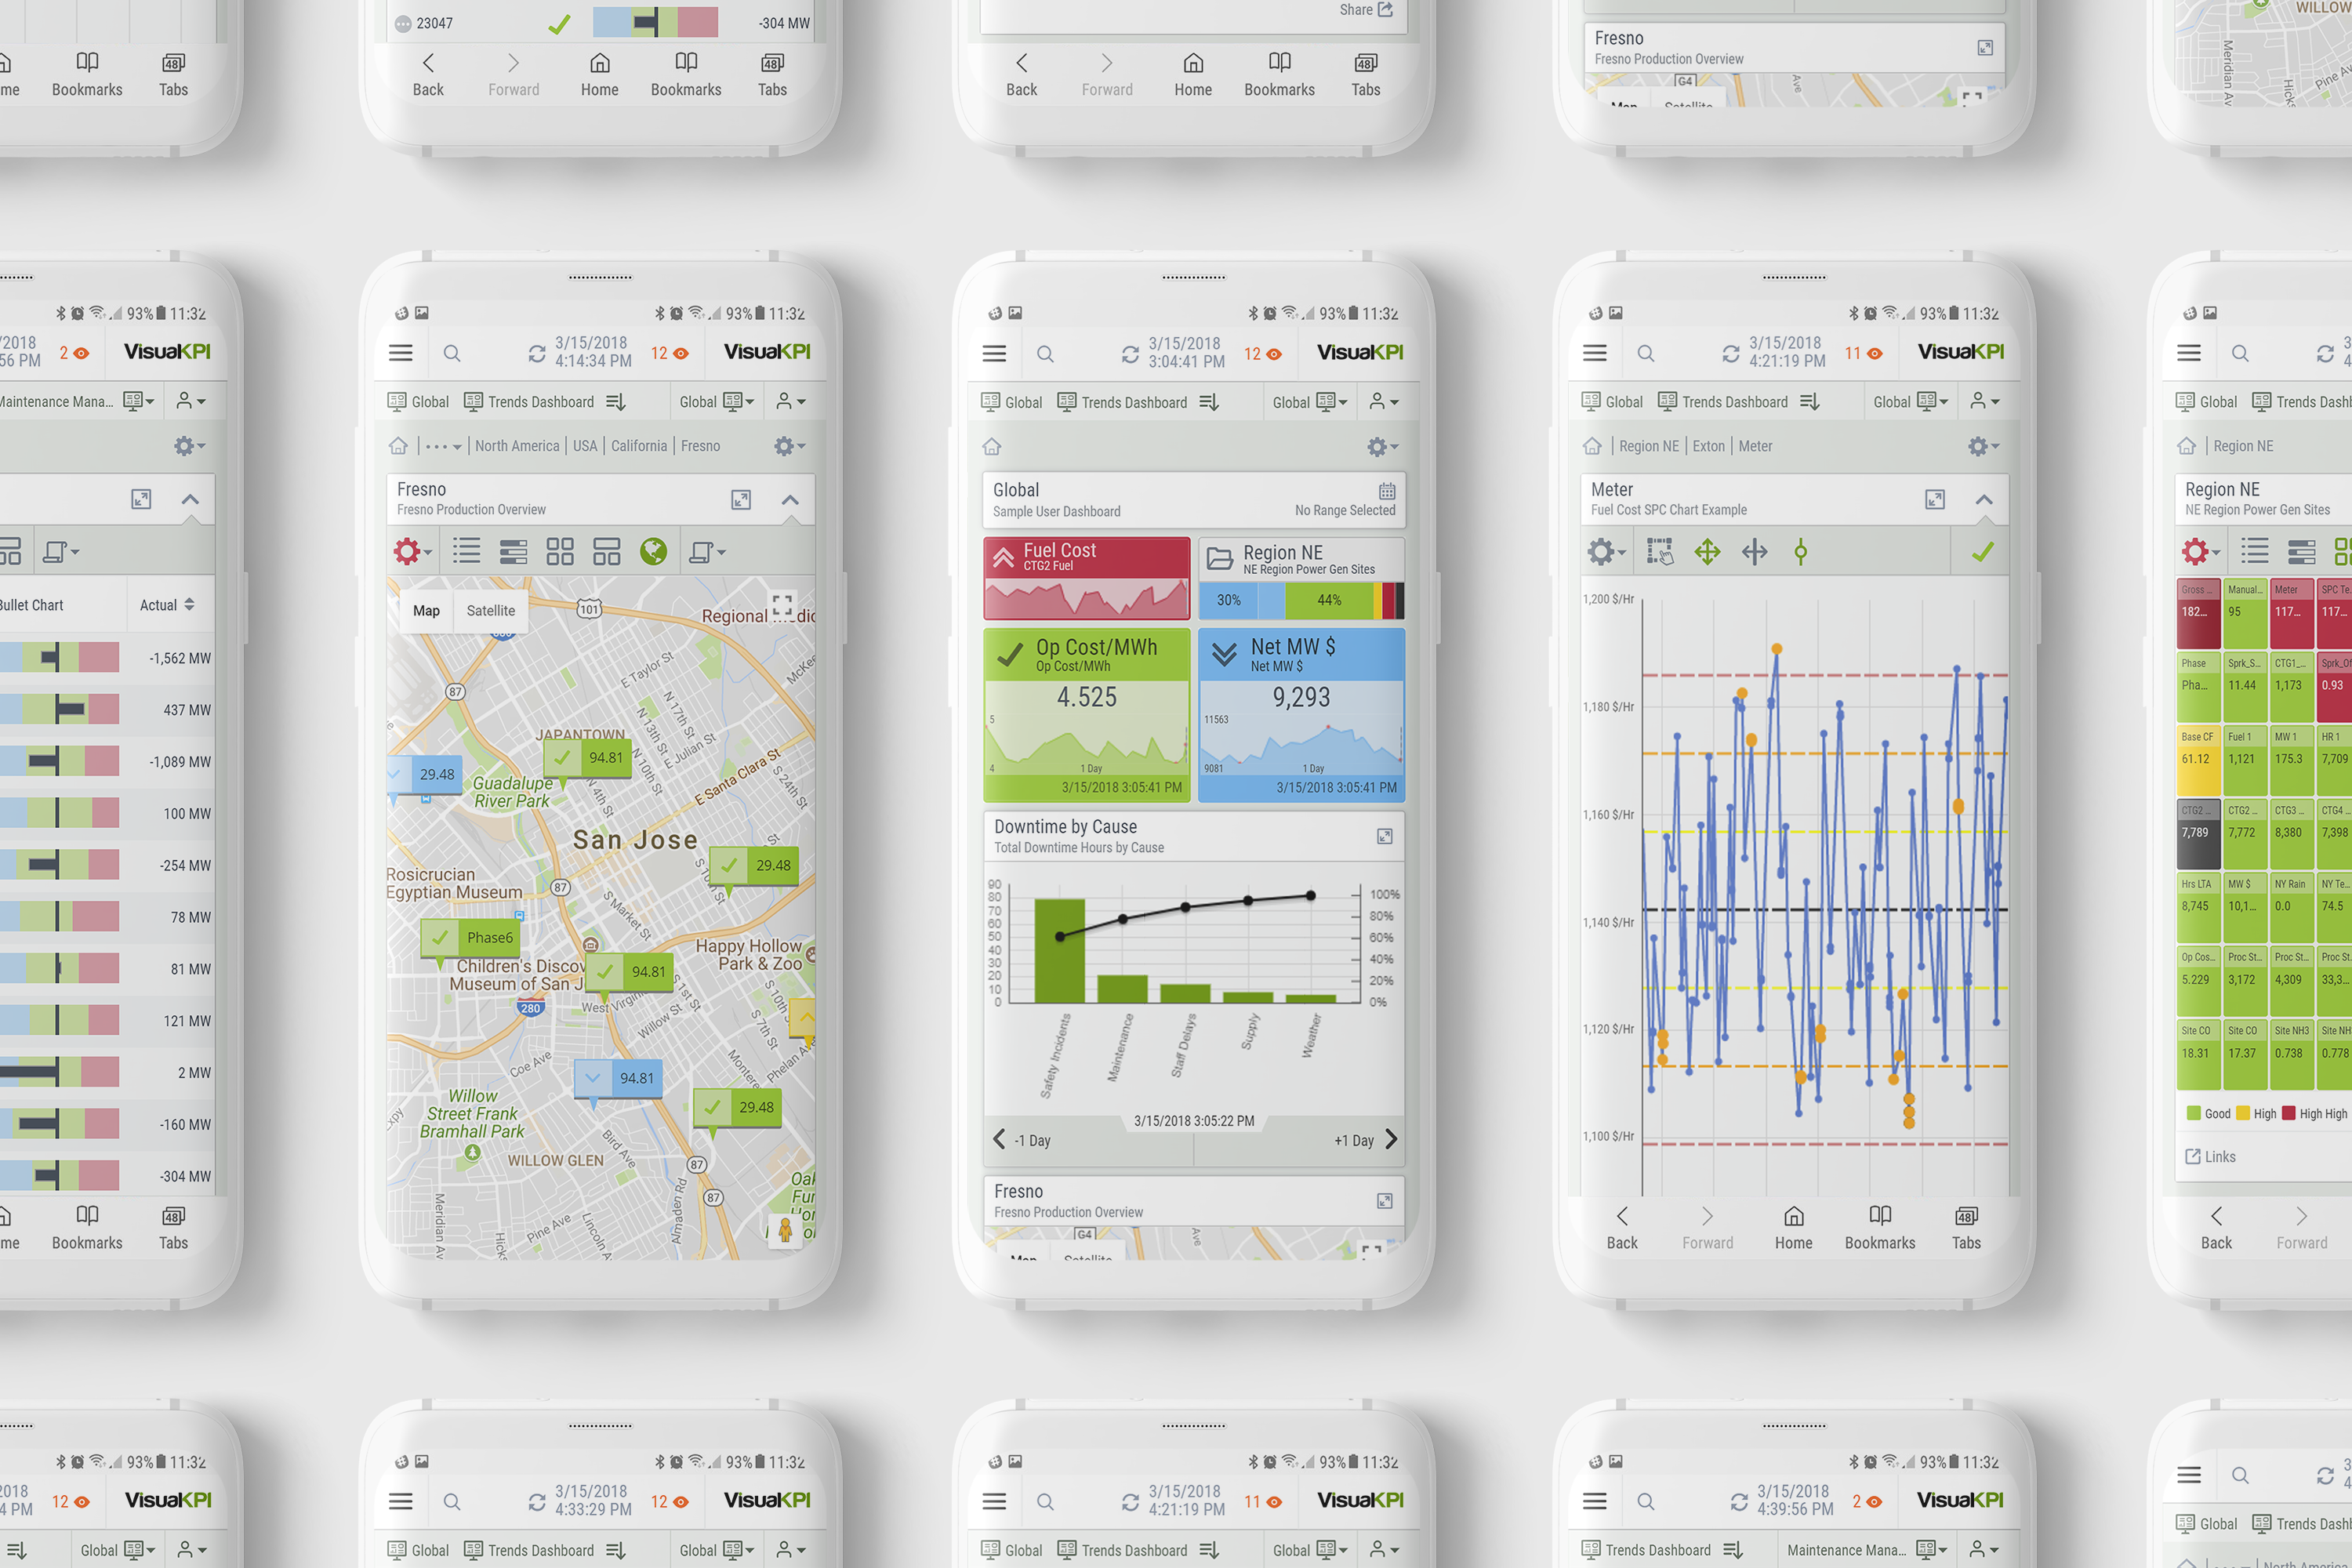
In open-pit gold mining, conditions change fast. As an operations leader, you balance production targets, equipment performance, and safety while managing shifting geology, unpredictable weather, and fluctuating commodity prices. Relying on static, end-of-shift or end-of-day reports leaves you reacting to yesterday’s problems instead of preventing today’s.
Real-time KPIs, dashboards and alerts can close that gap. By tracking critical metrics the moment they change, you can optimize equipment usage, maintain safety standards, and hit production goals without wasting resources. Below are 10 real-time KPIs specifically chosen for open-pit gold mining, designed to help you make faster, better decisions right from the pit to the processing plant.
1. Ore Tonnes Moved per Hour
Why it Matters: Shows the actual mining pace and ensures production is on track.
What it Measures: Total tonnes of ore moved to the crusher or stockpile each hour.
What Happens if Missed: Risk of falling behind daily targets and increasing unit costs.
Formula: Total ore tonnes moved ÷ operating hours.
Indicator Type: Current — shows ongoing production performance in real time.
Unit of Measure: Tonnes/hour.
Ideal Visualization(s): Line chart with target overlay.
Frequency: Real-time.
Data Required: Haul truck payload data, crusher feed measurements.
Pro Tip: Compare with haul truck utilization for efficiency insight.
Red Flag: Consistent hourly rate below target despite full fleet availability.
2. Equipment Utilization Rate
Why it Matters: Tracks whether assets are working as intended or sitting idle.
What it Measures: Percentage of available operating time when equipment is actively working.
What Happens if Missed: Missed productivity, wasted fuel, and higher unit costs.
Formula: (Operating time ÷ available time) × 100.
Indicator Type: Current — reflects present operational deployment.
Unit of Measure: Percentage.
Ideal Visualization(s): Bar chart or pareto chart by equipment category.
Frequency: Real-time.
Data Required: Equipment activity logs, GPS location data.
Pro Tip: Monitor high-value equipment separately to avoid hidden bottlenecks.
Red Flag: Large difference between fleet average and best-performing asset.
3. Fuel Consumption per Tonne Moved
Why it Matters: Links fuel efficiency to cost control and sustainability goals.
What it Measures: Average fuel usage for each tonne of ore moved.
What Happens if Missed: Rising fuel costs, increased emissions, and reduced profitability.
Formula: Total fuel consumed ÷ total ore tonnes moved.
Indicator Type: Lagging — shows efficiency over recent production periods.
Unit of Measure: Litres/tonne.
Ideal Visualization(s): Trend line with fuel price overlay.
Frequency: Hourly or real-time.
Data Required: Fuel dispensing records, haulage data.
Pro Tip: Break down by equipment type to pinpoint inefficiencies.
Red Flag: Sudden spike without corresponding changes in haul distance or load.
4. Crusher Throughput
Why it Matters: Determines how much material is processed and available for gold recovery.
What it Measures: Tonnes of ore crushed per hour.
What Happens if Missed: Potential backlog at the crusher or underutilized plant capacity.
Formula: N/A.
Indicator Type: Current — immediate view of processing performance.
Unit of Measure: Tonnes/hour.
Ideal Visualization(s): Gauge with target and maximum capacity markers.
Frequency: Real-time.
Data Required: Conveyor belt scales, crusher output sensors.
Pro Tip: Pair with ore grade KPI for true value throughput.
Red Flag: Throughput drop without corresponding drop in ore supply.
5. Ore Grade at Mill Feed
Why it Matters: Directly impacts gold recovery and revenue.
What it Measures: Average gold content in ore fed to the mill.
What Happens if Missed: Lower recovery rates, missed revenue, and inefficient processing.
Formula: N/A.
Indicator Type: Current — shows immediate quality of feed material.
Unit of Measure: Grams/tonne (g/t).
Ideal Visualization(s): Line trend with minimum acceptable grade threshold.
Frequency: Real-time.
Data Required: Sampling data from conveyors or feeders.
Pro Tip: Track in tandem with ore blending to maintain consistent grade.
Red Flag: Sharp drop in grade without planned blending change.
6. Haul Truck Cycle Time
Why it Matters: Highlights bottlenecks in load–haul–dump cycles.
What it Measures: Average time for a truck to complete a full cycle from load point to dump and return.
What Happens if Missed: Longer cycles reduce total material moved and increase fuel burn.
Formula: N/A.
Indicator Type: Leading — rising times can signal upcoming productivity drops.
Unit of Measure: Minutes.
Ideal Visualization(s): Histogram of cycle times.
Frequency: Real-time.
Data Required: GPS tracking, dispatch system logs.
Pro Tip: Segment by haul distance to isolate location-specific delays.
Red Flag: Consistent increase across fleet without obvious cause.
7. Drill Penetration Rate
Why it Matters: Monitors drilling efficiency and readiness for blasting.
What it Measures: Average drilling speed in metres per hour.
What Happens if Missed: Delays in blasting schedule, reduced ore availability.
Formula: Total metres drilled ÷ drilling hours.
Indicator Type: Current — direct view of progress against plan.
Unit of Measure: Metres/hour.
Ideal Visualization(s): Line chart with daily target overlay.
Frequency: Real-time.
Data Required: Drill machine performance logs.
Pro Tip: Monitor per rock type to optimize drill settings.
Red Flag: Significant slowdown without bit change or maintenance.
8. Fleet Availability
Why it Matters: Ensures enough working equipment to meet production targets.
What it Measures: Percentage of fleet operational and ready for work.
What Happens if Missed: Production bottlenecks due to unplanned maintenance or breakdowns.
Formula: (Operational units ÷ total units) × 100.
Indicator Type: Current — direct snapshot of readiness.
Unit of Measure: Percentage.
Ideal Visualization(s): Status dashboard grouped by equipment type.
Frequency: Real-time.
Data Required: Maintenance records, equipment status logs.
Pro Tip: Compare availability with utilization to spot underuse.
Red Flag: Drop in availability during peak demand periods.
9. Safety Incident Rate
Why it Matters: Measures safety performance and helps prevent repeat incidents.
What it Measures: Number of safety incidents per hours worked.
What Happens if Missed: Increased injury risk, regulatory issues, and operational disruptions.
Formula: (Incidents ÷ total hours worked) × 1,000,000 (for standard TRIFR).
Indicator Type: Leading — warns of likely disruptions.
Unit of Measure: Index score.
Ideal Visualization(s): Timeline overlaying weather data with production output.
Frequency: Hourly.
Data Required: Weather station data, production logs.
Pro Tip: Use in scheduling to minimize weather-related downtime.
Red Flag: Ignoring high-impact forecasts in planning.
Why Real-Time Visibility Matters
In open-pit gold mining, delays and inefficiencies add up quickly. Real-time KPIs allow you to respond immediately — rerouting trucks, adjusting drill schedules, or preventing costly equipment failures before they escalate. By acting on live insights instead of after-the-fact reports, you can keep operations safe, efficient, and profitable even when conditions are unpredictable.
How Transpara Can Help
If real-time operational visibility is a challenge you’re facing, you’re not alone. At Transpara, we help teams like yours gain clarity from complex systems without the need to centralize or overhaul your data stack.
If you want to learn more about what we do, or get more specific KPI examples for metallurgy analytics, water treatment, environmental factors, or multi-site operations management, just reach out to us. Learn more about Transpara Browse our documentation Contact us
In nuclear power generation, every decision counts. As an operations leader, you’re managing complex systems where even minor deviations can have serious safety, compliance, and economic consequences. Relying on lagging indicators or static reports means you’re always reacting to events after they’ve happened — often too late to prevent losses or downtime.
Real-time KPIs change that. By giving you instant visibility into plant health, safety margins, and operational efficiency, they allow you to act before small issues escalate. Below are 10 essential real-time KPIs designed specifically for your role in nuclear operations, each showing what to track, why it matters, and how to visualize it for maximum impact.
1. Reactor Thermal Power Output
Why it Matters: Ensures the reactor is operating within licensed limits, directly impacting safety, compliance, and revenue.
What it Measures: The real-time thermal power generated by the reactor core.
What Happens if Missed: Potential safety violations, regulatory penalties, or reduced generation efficiency.
Indicator Type: Lagging — shows past performance for the current shift.
Unit of Measure: Percentage deviation.
Ideal Visualization(s): Bar chart comparing planned vs actual (if hourly); Trend if real-time.
Frequency: Hourly or real-time.
Data Required: Planned generation schedule, actual output readings.
Pro Tip: Use alongside cause codes and trend comments for under- or overperformance.
Red Flag: Multiple shifts in a row showing negative deviation.
Why Real-Time Visibility Matters
In nuclear power generation, the difference between a controlled adjustment and a costly emergency often comes down to how quickly you detect and respond to changes. Real-time KPIs give operations leaders the clarity to act immediately, whether that means adjusting control rods, dispatching maintenance, or initiating safety procedures. They move you from reactive firefighting to proactive control, protecting both safety and profitability.
How Transpara Can Help
If real-time operational visibility is a challenge you’re facing, you’re not alone. At Transpara, we help teams like yours gain clarity from complex systems without the need to centralize or overhaul your data stack. Learn more about Transpara Browse our documentation Contact us
Let’s face it: most dashboards in industrial operations are a mess. Overstuffed with charts. Buried in tabs. Zero context. No status. No story. Just piles of data left to each users own interpretation.
We’ve seen this too often, and we get why it happens: there’s a belief that more data means more insight. In reality, it often means more confusion.
That’s where the 3-30-300 rule comes in. Originally developed for static BI reports, this simple framework maps perfectly to real-time operations dashboards—especially when throughput, safety, uptime, and compliance are on the line.
Let’s break it down and show you how to apply it to real-time operational intelligence displays that actually deliver.
What is the 3-30-300 Rule?
Think of it as designing for cognitive load, use case and job relevance. Can you answer the following questions in the specified amount of time:
In 3 seconds: Is everything okay?
In 30 seconds: Where’s the problem?
In 300 seconds (5 minutes): What’s causing it, and what do I do next?
That’s it. If your dashboard can answer all three clearly, quickly, and with zero training required, you’ve nailed it.
Let’s apply this to real-world operations using the KPI-centric design of Transpara’s real-time operational intelligence software.
3 Seconds: “Is Everything Running as Expected?”
This is the first screen anyone should see – especially execs, field staff, and supervisors.
Obvious status. Not charts. Not gauges. Status. Think obvious: green = good, red = bad, yellow = watch out. No legend required. There could be many levels of status, but the point remains and charts without color or status icons force users to read everything to find out what requires their attention.
Live data. Not “as of this morning.” Not “last week’s summary.” You need now. As a bonus, the combination of live, moving data and status allows you to alert users when something goes wrong (or even better, before it does by watching leading indicators)
No clicks required. If you have to drill down or read through tables or trends to see if there are problems, your dashboard failed the 3-second test. It should be as obvious as looking at the stock market app shown below.
Transpara tip: In addition to status colors, use KPI status icons which helps with accessibility. They’re fast, familiar, and instantly actionable—even on a phone.
30 Seconds: “Where’s the Problem?”
Now we zero in on the issue(s) by shifting from awareness to “where-ness.”
Hierarchies & filters. Geography, site, business unit, asset class, criticality and more. Users should easily be able to filter and drill with zero cognitive effort and get to the source of the issue. 1-3 clicks at most. Zero clicks preferred.
Comparisons. Show what’s underperforming in context. A temperature spike on one compressor may be fine—until you see the others are running 20°C cooler.
Contextual clues. Use metadata and attributes (e.g. asset type, age, location, product type) to enrich the view without crowding it.
Transpara tip: Use configurable attributes and smart filtering to show only what’s relevant. With our Unified Namespace (UNS) and unlimited attributes, users can slice by any attribute: status, site, shift, vendor, type, brand and more, without ever writing a query.
300 Seconds: “What Do I Do Next?”
This is your root cause and resolution phase.
Trend views & drill-downs. Depending on the issue, you might care more about its current status, its historical patterns, or its forecast. You might also need to compare it with other metrics to get the full picture. Pull up historical performance, event frames, and comparative metrics in seconds.
Integrated collaboration. Let users comment, share, or flag anomalies directly from the dashboard. No more emailing screenshots or static Excel files.
Decision support. Show not just what’s broken, but why—through linked KPIs (and influencers), anomaly detection, and even predictive indicators using AI & ML.
Transpara tip: Embed comments, calculated charts/KPIs, and frequently compared data right in the dashboard so users can move from “What happened?” to “What now?”—all in one screen. And yes, it works on your phone, too.
Why the 3-30-300 Rule Matters More in Operations
This isn’t just a user experience (UX) pattern. In industrial environments, the cost of bad dashboards isn’t just poor insight. The consequences can be expensive downtime, safety violations, missed production targets, or worse.
Here’s what goes wrong when the rule is ignored:
Too many charts = too little clarity
Too much detail = cognitive overload
Too slow to act = lost money (and maybe a job)
Great dashboard design in operations isn’t a “nice-to-have.” It’s how you avoid surprises and scale good decisions.
How Transpara Makes It Easy
Unlike traditional BI tools that force you to handcraft each report and hope users can figure it out, Transpara generates dynamic dashboards automatically based on your KPIs, assets, hierarchy and context.
No code. No giant consulting project. No waiting for IT to build or adjust a report.
KPI-centric, status-first views
Automatically performance roll ups and drill down
Mobile-ready, out-of-the-box
Alerts users before they know they need to look
Real-time, streaming, and role-based
If your dashboards don’t work in 3 seconds, 30 seconds, or 300 seconds, they aren’t helping—they’re hurting.
Discover how Visual KPI provides remote operations teams with real-time access to critical metrics, enhancing decision-making, collaboration, and operational efficiency.
Remote work has reshaped industries, pushing operations teams to adapt to decentralized environments. In sectors like manufacturing, energy, logistics, and healthcare, staying connected to real-time data is essential—even when teams are offsite. Visual KPI Monitoring delivers live insights and analytics, helping remote teams stay informed, respond quickly to challenges, and keep workflows running smoothly.
The Challenges of Remote Operations
Managing operations remotely comes with obstacles that traditional monitoring systems often struggle to handle:
Limited Real-Time Visibility: Without live data, teams take longer to react to operational changes, increasing downtime and inefficiencies.
Communication Gaps: A lack of immediate updates can slow down decision-making and create operational risks.
Data Security Concerns: With teams working from multiple locations, maintaining system integrity and secure access becomes more complex.
Disconnected Workflows: Siloed or inaccessible data can make it difficult for different departments to stay aligned.
By addressing these challenges, Visual KPI empowers remote teams with the tools they need to maintain efficiency, improve collaboration, and make data-driven decisions—no matter where they are.
How Visual KPI Enables Seamless Remote Work
Managing remote operations comes with challenges, from monitoring equipment performance to ensuring quick decision-making. Visual KPI Monitoring helps teams stay connected by providing real-time access to critical operational metrics.
1. Real-Time Data Access from Anywhere
For remote teams, having up-to-date insights is crucial for making informed decisions. Visual KPI dashboards deliver live updates on equipment performance, system health, and process efficiency—helping teams respond faster and work more efficiently.
Application: Field technicians can check machine diagnostics in real time before arriving on-site, ensuring they bring the right tools and solutions.
2. Smarter Decision-Making with Mobile Dashboards
Operations teams no longer need to be in a control room to monitor key performance indicators (KPIs). Visual KPI solutions provide fully responsive dashboards accessible on smartphones, tablets, and laptops.
Advantage: Managers can track performance metrics from anywhere, making it easier to stay informed and take action when needed.
With real-time access to data, teams across different locations can collaborate more effectively. Visual KPI integrates with communication tools to ensure alerts and updates reach the right people instantly.
Use Case:Logistics companies use Visual KPI to monitor fleet performance. Drivers and dispatchers receive instant alerts about delays or safety concerns, reducing delivery errors by 22%.
4. Predictive Analytics for Proactive Maintenance
Equipment failures can be costly, especially in remote operations. Predictive analytics powered by Visual KPI helps detect potential issues before they lead to downtime.
Impact: Remote teams can schedule maintenance proactively, minimizing disruptions and extending equipment lifespan.
5. Secure, Cloud-Based Data Management
Security is a top priority for remote teams handling sensitive data. Visual KPI solutions use encrypted, cloud-based platforms with role-based access to ensure data integrity and compliance.
Benefit: Only authorized personnel can access or modify critical KPIs.
Industry Example: Healthcare providers using cloud-based Visual KPI systems ensure HIPAA compliance while allowing doctors and administrators to monitor patient safety metrics remotely.
Implementing Visual KPI for Remote Operations
Adopting Visual KPI can help remote operations run smoothly by providing real-time insights and improving team collaboration. Here’s how to make the most of it:
Identify Key Performance Metrics
Start by defining the most critical KPIs for your remote operations, such as:
Equipment uptime: Monitor system availability to reduce unexpected downtime.
Energy consumption: Track usage patterns to improve efficiency and lower costs.
Production efficiency: Ensure optimal performance by analyzing output trends.
Safety incidents: Stay ahead of potential risks with real-time safety data.
Deploy a Cloud-Based Visual KPI System
Choose a platform that integrates seamlessly with your existing infrastructure and allows teams to access dashboards securely from any device—whether they’re in the office, in the field, or working remotely.
Train Teams on Remote Monitoring Best Practices
Give employees the tools and knowledge they need to make data-driven decisions. Training should focus on how to interpret KPI dashboards, respond to real-time alerts, and take proactive steps to optimize performance.
Continuously Optimize Workflows
Use insights from Visual KPI data to identify inefficiencies and improve processes. Regularly reviewing trends and adjusting strategies helps maintain peak performance across remote operations.
Unlock the Full Potential of Remote Work
Transitioning to remote operations doesn’t have to mean sacrificing efficiency or increasing risks. With Visual KPI Monitoring, teams gain real-time visibility, mobile access, predictive analytics, and secure data management—all essential for maintaining high performance.
Want to see how Visual KPI can transform your remote operations? Let’s talk! Contact us today to learn more.
Unlock Operational Intelligence with Transpara Visual KPI: Breaking Down Data Silos
Eliminating data silos is essential for gaining operational intelligence and staying competitive. Transpara Visual KPI provides a powerful solution for operations executives, engineers, and data analysts who need effective data visualization tools. By integrating data from various sources into unified views and real-time dashboards, Transpara Visual KPI allows for efficient KPI tracking and enhances business intelligence. In this article, we will explore how Transpara Visual KPI can transform your approach to data visualization, helping you fully tap into the potential of your operational data.
Transforming Data Silos into Unified Views
Understanding Data Silos in Operations
In many organizations, data silos occur when different departments or teams use separate systems to collect and store information. This separation can disrupt the flow of data, making it hard for operations executives, engineers, and data analysts to get a complete picture of business performance. Data silos lead to inefficiencies, often resulting in duplicated work and inconsistent reporting. They can also slow down decision-making by hiding important insights that are critical for strategic planning. The challenge is to bring these different data sources together into a unified system that provides real-time operational insights. Transpara Visual KPI solves this problem by creating integrated views that bring together data from various sources. These unified views help organizations simplify their processes, improve KPI tracking, and make better decisions, leading to enhanced performance and greater competitiveness in the marketplace.
The Role of Transpara Visual KPI
Transpara Visual KPI plays a crucial role in transforming data silos into unified views by integrating diverse data sources into a single, comprehensive dashboard. Its real-time data visualization capabilities allow operations executives, engineers, and data analysts to access and interact with crucial performance metrics without the need for complex data migrations. By leveraging Transpara Visual KPI, organizations can achieve a 360-degree view of their operations, facilitating more effective KPI tracking and business intelligence. This integration reduces the time and resources spent on data gathering and analysis, allowing teams to focus on strategic decision-making. The platform’s intuitive design enables users to quickly identify trends, anomalies, and opportunities for improvement, empowering them to make data-driven decisions with confidence. By breaking down data silos and offering a user-friendly visualization experience, Transpara Visual KPI ensures that organizations can operate more efficiently and maintain a competitive edge in their respective industries.
Benefits of Unified Data Views
Unified data views offer many benefits that significantly enhance operational intelligence and efficiency. First, they provide a comprehensive snapshot of an organization’s performance by consolidating data from different sources into a single platform. This holistic view helps operations executives, engineers, and data analysts quickly identify trends, pinpoint inefficiencies, and make informed decisions. Additionally, unified views facilitate improved collaboration across departments by ensuring all team members have access to the same real-time information, breaking down communication barriers that typically arise from data silos.
Moreover, these integrated views support proactive management. Real-time dashboards and alerts enable teams to respond swiftly to emerging issues, reducing downtime and preventing minor problems from escalating. Enhanced data visibility also aids in predictive maintenance, optimizing resource allocation and extending the lifespan of critical assets. Ultimately, by leveraging unified data views, organizations can achieve higher productivity, better resource management, and a stronger competitive position in their industry.
Harnessing Operational Intelligence
Real-Time Dashboards for Decision Making
Real-time dashboards serve as an essential tool for decision-making within any organization. These dashboards provide up-to-the-minute data visualizations, enabling operations executives, engineers, and data analysts to monitor key performance indicators (KPIs) and metrics as they evolve. This immediate access to current data ensures that decision-makers can quickly identify issues, trends, and opportunities, allowing for timely and informed responses.
The dynamic nature of real-time dashboards eliminates the lag associated with traditional reporting methods, which often rely on outdated information. By presenting data in a visually intuitive format, these dashboards facilitate quicker comprehension and analysis, empowering teams to make proactive adjustments rather than reactive fixes. Additionally, real-time dashboards support better resource allocation by highlighting areas that require immediate attention, thus optimizing operational efficiency.
Incorporating real-time dashboards into daily operations not only enhances situational awareness but also drives continuous improvement. This results in more agile and responsive decision-making processes, ultimately boosting overall organizational performance and competitiveness.
Enhancing KPI Tracking with Visual KPI
Enhancing KPI tracking is a pivotal component of harnessing operational intelligence, and Visual KPI excels in this domain. By providing real-time, visually engaging dashboards, Visual KPI ensures that key performance indicators are continuously monitored and updated. This allows operations executives, engineers, and data analysts to track progress against goals effortlessly and identify deviations promptly.
Visual KPI offers a cohesive and intuitive interface that aggregates data from multiple sources, presenting it in a single, unified view. This eliminates the need for manual data compilation and significantly reduces the risk of errors. The platform’s customizable alerts and status indicators ensure that critical metrics are always in focus, enabling teams to take immediate corrective actions when necessary.
Furthermore, Visual KPI’s ability to display historical trends alongside real-time data provides valuable context, aiding in the identification of long-term patterns and the formulation of strategic plans. By enhancing KPI tracking, Visual KPI empowers organizations to operate more efficiently, make data-driven decisions, and achieve sustained performance improvements.
Business Intelligence through Data Visualization
Data visualization is a cornerstone of effective business intelligence, transforming complex datasets into clear, actionable insights. For operations executives, engineers, and data analysts, the ability to visualize data in real-time is invaluable. It allows them to grasp intricate patterns and relationships quickly, which might be overlooked in raw data formats.
Through intuitive charts, graphs, and dashboards, data visualization tools like Transpara Visual KPI enable teams to monitor and interpret key performance indicators (KPIs) seamlessly. This visual context supports more informed and timely decision-making, enhancing organizational agility. By presenting data in a digestible format, these tools facilitate communication and collaboration across departments, ensuring everyone has access to the same critical insights.
Moreover, data visualization aids in identifying trends, forecasting future performance, and uncovering hidden opportunities or risks. This comprehensive view empowers organizations to optimize operations, drive strategic initiatives, and maintain a competitive edge in their industry. Ultimately, business intelligence achieved through data visualization is a powerful enabler of efficient and informed business operations.
Real-World Applications and Success Stories
Case Studies of Operational Intelligence Success
Case studies of operational intelligence success provide tangible proof of the transformative impact that tools like Transpara Visual KPI can have on organizations across different industries. In one instance, a leading manufacturing firm implemented Visual KPI to consolidate data from disparate systems, resulting in a significant reduction in unplanned downtime. By leveraging real-time dashboards and alerts, the company improved its maintenance processes, achieving a 51% reduction in downtime and substantial cost savings.
Another success story comes from the energy sector, where a utility company used Visual KPI to enhance its monitoring capabilities. By integrating real-time data from multiple sources, the company improved its crisis response time by 69%, allowing for quicker resolution of operational issues and better service delivery to its customers.
These examples highlight how operational intelligence solutions can drive efficiency, reduce costs, and enhance overall performance. They underscore the importance of data-driven decision-making in achieving strategic objectives and gaining a competitive advantage in today’s fast-paced business environment.
Overcoming Challenges with Transpara Visual KPI
Organizations across multiple industries face significant challenges in managing and interpreting large volumes of operational data. Transpara Visual KPI provides a powerful solution by simplifying data integration and visualization. Many companies struggle with fragmented data systems that make it difficult to gain comprehensive insights. Transpara Visual KPI integrates these systems, offering a unified view that makes data more accessible and easier to analyze.
In addition, outdated reporting methods often slow down decision-making. With Transpara Visual KPI’s real-time dashboards, organizations gain instant access to critical information, enabling faster and better-informed decisions. This reduces downtime and boosts operational efficiency, which is especially important in sectors like manufacturing and utilities.
By automating KPI tracking and alerts, Transpara Visual KPI also lightens the manual workload for teams, freeing them to focus on strategic priorities rather than gathering data. Ultimately, Transpara Visual KPI helps organizations tackle data challenges, leading to better performance and a stronger competitive edge.
Future Trends in Data Visualization and Intelligence
As technology continues to evolve, the future of data visualization and intelligence is poised to significantly enhance operational capabilities. The integration of artificial intelligence (AI) and machine learning (ML) into data visualization tools is expected to automate and improve the accuracy of predictive analytics. This advancement will enable organizations to forecast trends and potential issues with greater precision, enhancing decision-making and strategic planning.
Moreover, the growing adoption of Internet of Things (IoT) devices will lead to an exponential increase in the volume of data generated. This surge will necessitate more sophisticated visualization tools that can process and present large datasets in a comprehensible manner. Enhanced interactivity and immersive technologies, such as augmented and virtual reality, will likely become more prevalent, offering users a deeper understanding of complex data patterns.
As these trends unfold, organizations that leverage advanced data visualization and intelligence solutions like Transpara Visual KPI will be better equipped to maintain a competitive edge, driving innovation and efficiency across their operations.
A Industrial Plants Manager’s Guide to Advanced Data Visualization: Transpara’s Solutions Explained
In the fast-paced world of industrial operations, staying ahead of the curve is not just an option—it is a necessity. Enter Transpara’s advanced data visualization solutions, a game-changer for plant managers seeking to harness the power of real-time data. With features like IoT dashboards and Grafana KPIs, these tools provide a comprehensive suite for monitoring, analytics, and alerting, turning raw data into actionable insights. Whether you’re in energy, manufacturing, or telecommunications, Transpara’s solutions offer the clarity and control you need to make informed decisions and drive efficiency. Ready to transform your plant’s data into a strategic asset? Let’s explore how Transpara can elevate your operations to new heights.
Understanding Transpara’s Visualization Tools
Streamlining IoT Dashboard Use
Incorporating IoT dashboards into your operations can dramatically enhance data visibility and decision-making. Transpara’s IoT dashboard solutions simplify this process by offering a easy integration with existing data systems, allowing plant managers to view real-time data from multiple sources in one unified interface. This integration ensures that crucial data points are not only accessible but also actionable, thanks to the intuitive design that emphasizes key performance indicators (KPIs). The dashboards are designed to minimize the learning curve, with features that include drag-and-drop customization, real-time alerts, and interactive data visualizations. These tools ensure that teams can quickly adapt to any changes in operational status, thereby reducing unplanned downtime and improving overall efficiency. By centralizing data on an IoT dashboard, operations become more transparent, and plant managers can make informed decisions fast as possible, effectively transforming data into a strategic business asset.
Leveraging Grafana KPIs for Insight
Grafana KPIs are a vital component of Transpara’s data visualization toolkit, providing plant managers with the ability to transform complex data into clear, actionable insights. By leveraging Grafana’s advanced capabilities, users can create dynamic dashboards that highlight critical performance metrics, making it easier to identify trends and anomalies. These KPIs are made to reflect the specific needs of your operation, ensuring that each data point is relevant and impactful. The ability to visualize data in real-time allows managers to quickly respond to any issues, reducing operational risks and enhancing productivity. Additionally, Grafana’s integration with different data sources means that you can pull in information from disparate systems without the hassle of data migration. This connectivity enhances the accuracy and reliability of your insights. In essence, Grafana KPIs empower decision-makers to optimize performance, anticipate challenges, and drive strategic initiatives with confidence.
Enhancing Plant Operations
Real-time Monitoring and Alerts
Real-time monitoring and alerts are crucial for maintaining operational efficiency and avoiding costly downtime in industrial settings. Transpara’s solutions excel in providing continuous, real-time surveillance of your plant’s operations, ensuring that any deviation from the norm is immediately flagged. This proactive approach allows plant managers to address potential issues before they escalate into significant problems. The alert system is customizable, enabling the configuration of specific triggers based on your operation’s unique requirements. Alerts can be set to notify teams via different channels such as emails or text messages, ensuring timely response regardless of location. By integrating easily with your existing systems, these tools consolidate data from multiple sources, providing a comprehensive view of operations. This level of insight not only enhances immediate response capabilities but also contributes to long-term strategic planning by identifying patterns that could indicate areas for improvement. With real-time monitoring and alerts, decision-makers can focus on optimizing performance and minimizing risk.
Advanced Analytics for Decision Makers
Advanced analytics are a game-changer for decision-makers looking to transform raw data into strategic insights. Transpara’s analytics capabilities offer a deep dive into operational data, enabling plant managers to make data-driven decisions with confidence. By employing predictive analytics and machine learning, Transpara can forecast trends, identify potential issues before they arise, and suggest corrective actions. This foresight is crucial for optimizing resource allocation and enhancing productivity. Furthermore, the analytics platform is designed to be user-friendly, providing intuitive interfaces that do not require a background in data science to interpret. Users can generate complex reports and visualizations that summarize key metrics and performance indicators, facilitating a better understanding of plant operations. This enables teams to focus on strategic initiatives rather than getting bogged down by data processing. By leveraging advanced analytics, decision-makers can enhance their operational strategies, improve cost-efficiency, and maintain a competitive edge in their industry.
Implementing Transpara’s Solutions
Integrating with Existing Systems
Integrating Transpara’s solutions with existing systems is designed to be straightforward, minimizing disruption and maximizing efficiency. Transpara’s platform is compatible with a wide range of industrial systems, including SCADA, IoT devices, and many types of databases. This compatibility allows for data to flow without the need for extensive data migration projects. By leveraging open APIs and standard data protocols, Transpara ensures that your existing investments in IT infrastructure are preserved, reducing the need for costly overhauls. The integration process is streamlined to reduce setup time and accelerate the realization of benefits. Once integrated, Transpara provides a unified view of all operational data, enhancing visibility and facilitating improved decision-making. This comprehensive integration ensures that all stakeholders have access to consistent and up-to-date information, fostering a more collaborative environment. Ultimately, integrating Transpara with your existing systems enhances operational coherence and supports strategic objectives.
Training and Support for Easy Adoption
Ensuring a smooth transition to Transpara’s solutions requires comprehensive training and support designed to your team’s needs. Transpara offers a robust training program designed to upskill your workforce quickly, minimizing downtime during the adoption phase. Training sessions are interactive and can be customized to focus on the specific functionalities most relevant to your operations. These sessions can be delivered in different formats, such as in-person workshops or online modules, making them accessible regardless of location. In addition to training, Transpara provides ongoing support to address any technical challenges that may arise. This support includes access to a dedicated helpdesk, detailed documentation, and regular software updates to ensure optimal performance. By offering a combination of training and continuous support, Transpara ensures that your team is fully equipped to leverage the platform’s capabilities effectively. This adoption process enhances productivity and accelerates the realization of operational benefits.
From Chaos to Clarity: How Real-Time KPIs Revolutionize Remote Workforce Management
In the ever-evolving landscape of remote workforce management, staying ahead of the curve is not just a goal—it is a necessity. Enter real-time KPIs, the game-changer that transforms chaos into clarity and empowers decision-makers with the tools they need to enhance productivity and streamline operations. By leveraging real-time performance metrics, operations managers, and team leaders can make data-driven decisions that propel their teams to new heights. This guide will delve into how these dynamic indicators revolutionize remote workforce management, offering a clear path to improved efficiency and unparalleled oversight.
Transforming Remote Workforce Management
Understanding Real-Time KPIs
Real-time KPIs are pivotal in transforming remote workforce management by providing instantaneous insights into team performance and operations. Unlike traditional metrics that rely on historical data, real-time KPIs offer a current snapshot of activity, allowing managers to address issues as they arise. They enable operations managers and team leaders to track critical aspects such as workforce productivity and task completion rates without delay. Through the use of data-driven decision-making, these KPIs help identify bottlenecks and inefficiencies, providing a basis for timely interventions. By embracing these metrics, organizations can foster a proactive management style that enhances overall efficiency. Moreover, real-time KPIs facilitate transparent communication, ensuring that team members are aligned with organizational goals and aware of their performance expectations. This immediate feedback loop is invaluable for maintaining motivation and accountability among remote workers, ultimately leading to improved performance and outcomes.
Enhancing Workforce Productivity
Enhancing workforce productivity in a remote setup hinges on the effective use of real-time KPIs. By continuously monitoring these performance metrics, managers can identify areas of improvement and implement corrective actions swiftly. Real-time KPIs allow for the tracking of various productivity indicators, such as task completion rates, active work hours, and employee engagement levels. This constant flow of data provides insights that can highlight any discrepancies in productivity, enabling managers to offer targeted support or resources to team members who may be struggling. Additionally, these metrics can reveal patterns and trends over time, helping to optimize workflows and allocate resources more efficiently. By leveraging real-time KPIs, organizations can create a culture of continuous improvement, where feedback is immediate, and adjustments are made proactively. This approach not only boosts individual performance but also enhances overall team productivity, leading to better outcomes and a more efficient remote workforce.
Integrating Performance Metrics
Integrating performance metrics into remote workforce management systems is crucial for maintaining an effective and responsive team environment. The process begins by selecting the right set of metrics that align with organizational goals and are relevant to remote work dynamics. These metrics should cover key areas such as task efficiency, communication effectiveness, and overall workforce productivity. By embedding these metrics into real-time dashboards, managers gain instant access to actionable data, facilitating quick decision-making. Additionally, integrating performance metrics with collaboration tools ensures that all team members have visibility on their progress and areas needing improvement. This transparency fosters a sense of accountability and motivates employees to meet their targets. Furthermore, integrated metrics can be used to provide personalized insights for different roles within the team, ensuring that specific needs and challenges are addressed. By consolidating performance data into a unified system, organizations can streamline operations and enhance the agility of their remote workforce.
The Power of Data-Driven Decision Making
Leveraging Real-Time Dashboards
Real-time dashboards are essential tools for data-driven decision-making, offering a visual representation of key performance indicators as they unfold. These dashboards allow decision-makers to monitor operations, spot trends, and address issues promptly. By consolidating data from various sources into a single interface, real-time dashboards provide a comprehensive view of workforce productivity and performance metrics. This integration empowers managers to make informed decisions based on current data rather than outdated or static reports. Furthermore, real-time dashboards can be customized to display specific metrics relevant to different users, ensuring that everyone from executives to team leaders has access to the insights they need. These dynamic displays not only enhance situational awareness but also facilitate strategic planning and resource allocation. As a result, leveraging real-time dashboards enables organizations to react swiftly to changes, optimize processes, and ultimately improve their competitive edge in managing remote workforces effectively.
Advanced Analytics for Better Insights
Advanced analytics play a pivotal role in extracting deeper insights from real-time data, enabling more strategic data-driven decision-making. By utilizing sophisticated analytical models and algorithms, organizations can uncover patterns and correlations that are not immediately apparent through basic data monitoring. These analytics facilitate predictive insights, allowing managers to forecast potential challenges and opportunities before they arise. For instance, predictive analytics can identify trends in workforce productivity, helping to anticipate staffing needs or detect signs of employee burnout. Furthermore, advanced analytics can segment data to provide insights for different departments or roles, enhancing the relevance and applicability of the conclusions drawn. By integrating these insights into decision-making processes, organizations can make more informed, proactive choices that drive performance and efficiency. Ultimately, advanced analytics provide a competitive advantage by transforming raw data into actionable intelligence, thus enabling organizations to navigate the complexities of remote workforce management with greater precision and agility.
Streamlining Monitoring and Alerting
Optimizing monitoring and alerting is essential for effective data-driven decision-making, especially when managing a remote workforce. By using automated systems that constantly track key performance metrics, organizations can stay informed about significant changes in real-time. These systems generate alerts whenever specific limits are reached, allowing for immediate action to address potential issues. This proactive method reduces the risk of disruptions and ensures smooth operations. Additionally, customized alert systems can be set up to prioritize notifications based on urgency, ensuring that critical matters are addressed promptly by the right team members. By shortening the time between identifying and resolving issues, enhanced monitoring and alerting improve operational efficiency and workforce productivity. Furthermore, these systems help prevent minor problems from growing into larger ones, saving time and resources in the long term. Overall, such efficient processes are crucial for maintaining flexible and responsive management in today’s fast-paced business landscape.
Choosing the Right Tools
Evaluating Software Features
When choosing software for managing a remote workforce, it is important to prioritize tools that offer strong data integration, real-time KPI tracking, and powerful analytics. The right software should pull data from different sources, giving a clear view of operations without requiring complicated data migration. Look for customizable dashboards that let users see performance metrics that matter to their specific roles.
The software should also include advanced analytics to provide predictive insights and support data-driven decisions. Monitoring and alert features are key as well, allowing teams to stay proactive by receiving real-time alerts about any performance changes. Additionally, the software should be easy to use, with minimal training required for quick adoption across the organization. It is important to choose a tool that can scale and adapt as your organization grows, making it easy to incorporate new technologies. By focusing on these features, businesses can find a solution that improves operational efficiency and supports effective remote workforce management.
Implementing Data Visualization Solutions
Using data visualization tools is an important step in improving how remote teams are managed. These tools turn raw data into simple visuals like charts and graphs, making complex information easier to understand and act on. When choosing a data visualization tool, focus on those that offer real-time updates and allow users to customize their dashboards, ensuring everyone sees the most relevant, up-to-date information. The tool should also be able to pull data from different sources automatically, giving a complete view without manual input. It is important that the tool is easy to use, so your team can start using it without much training. Good tools should also let users interact with the data, allowing them to explore more details. By using these solutions, businesses can improve how they make decisions, boosting efficiency, productivity, and overall performance in managing remote teams.
Optimizing for Industry-Specific Needs
Optimizing for industry-specific needs is essential when selecting tools for remote workforce management. Different industries have unique requirements and challenges, and the chosen software must cater to these specificities. For instance, in sectors like energy, utilities, and manufacturing, real-time monitoring of machinery and environmental conditions is crucial. Software in these industries should offer advanced analytics to predict equipment failures and optimize maintenance schedules. In the telecommunications and IT sectors, the focus might be on network performance and uptime, requiring robust alerting systems to address any issues immediately. Additionally, the tool should support compliance with industry regulations and standards, ensuring that all operations are within legal and safety guidelines. Customizability is key; the software should allow for dashboards and KPIs that reflect the unique metrics of the industry. By aligning the tool’s capabilities with industry-specific needs, organizations can achieve more effective remote workforce management and drive better overall performance.
Cutting Costs and Reducing Emissions in the Cement Industry: The Power of Real-Time Monitoring & Analytics
In the cement industry, where operational efficiency and environmental compliance are as critical as the cement itself, the integration of real-time data monitoring is proving to be a game-changer. By adopting Visual KPI, cement plants can transform their data into a powerhouse of insights, reducing energy consumption and cutting emissions with surprising ease. Imagine a world where predictive maintenance tools not only anticipate equipment failures but also slash maintenance costs by 20%—all while boosting production efficiency. It’s like having a crystal ball, but instead of foretelling your demise, it predicts how you can save money and the planet simultaneously. This isn’t just smart; it’s essential for staying competitive and sustainable.
Transforming Cement Production with Real-Time Monitoring
Cement Industry Challenges
The cement industry faces a multitude of challenges in maintaining efficiency and compliance. These include equipment performance, quality of raw materials, and stringent environmental regulations. The huge amount of data generated in these processes can easily become overwhelming, making it difficult to derive operational guidance or even understand simple questions like, “How’s it going?”
Separately, the cement industry is notorious for high energy consumption and emissions, which continue to attract regulatory scrutiny. These issues not only affect operational efficiency but also impact profitability and sustainability. By employing a real-time monitoring platform like Transpara’s Visual KPI, cement plants can transform these operational challenges into opportunities, optimizing processes, reducing waste, and enhancing compliance. This approach empowers decision-makers at all levels (even management!) with timely, accurate data, allowing for swift adjustments and improved overall performance.
The Role of Visual KPI
Visual KPI plays a crucial role in revolutionizing cement production by providing a real-time operational intelligence platform that delivers the right data to the right people at the right time. This software aggregates data from various sources (thousands supported), offering a comprehensive and dynamic view of plant operations. By delivering critical metrics through customizable dashboards and real-time KPIs (with alerting, context, status and color), Visual KPI enables instant access to important data on energy consumption, raw material quality, and equipment efficiency. It transforms raw data into meaningful insights, facilitating proactive decision-making without the need for training. With features like proactive maintenance alerts, it anticipates equipment failures, thereby reducing downtime by up to 30% and cutting maintenance costs by 20%. The real-time monitoring capabilities of Visual KPI also support environmental compliance by optimizing processes to reduce emissions. As a result, cement plants can achieve greater operational efficiency and cost-effectiveness while meeting sustainability goals. This makes Visual KPI an indispensable tool for staying competitive in the demanding cement industry landscape.
Enhancing Operational Efficiency and Sustainability
Below are three of the most common ways Transpara’s customers gain a competitive advantage and optimize operations with Visual KPI:
1. Reducing Energy Consumption
Reducing energy consumption is a paramount concern in the cement industry, given its high energy demands and environmental impact. Real-time operations monitoring tools like Visual KPI play a critical role in addressing this issue. By providing live data on key performance indicators, these systems allow for immediate adjustments to optimize energy use. For example, monitoring fuel efficiency and heat rates in real-time enables operators to fine-tune processes, reducing unnecessary energy consumption. Moreover, by reducing energy consumption, cement plants can significantly cut their carbon footprint, contributing to broader sustainability goals. The ability to continually monitor and improve energy use ensures that plants can operate more efficiently and responsibly, making real-time data visualization an essential tool for the industry.
2. Improving Product Quality
Improving product quality is vital for maintaining competitiveness and customer satisfaction in the cement industry. Visual KPI significantly enhance quality control by providing continuous insights into various production parameters. For instance, monitoring the chemical composition and particle size distribution in real-time operations allows for immediate adjustments, ensuring uniformity before materials enter the clinker production phase. This reduces variability and stabilizes operations, leading to more consistent product quality. Consistent monitoring helps detect deviations early, preventing defective batches and reducing material waste. Enhanced product quality not only meets stringent industry standards but also improves customer trust and satisfaction. By adopting Visual KPI, cement plants can maintain high-quality outputs, thus driving long-term profitability in a highly competitive market.
3. Predictive Maintenance and Cost Savings
Predictive maintenance is revolutionizing the cement industry by minimizing unexpected equipment failures and reducing overall maintenance costs. Real-time operations monitoring tools like Visual KPI enable proactive and predictive maintenance by continuously analyzing equipment performance data. This allows operators to anticipate potential failures before they occur, ensuring timely interventions that prevent costly downtime. By identifying wear and tear patterns early, maintenance can be scheduled proactively, avoiding emergency repairs and extending equipment lifespan. This strategic approach not only cuts costs but also enhances operational efficiency by keeping machinery running optimally. Besides, predictive maintenance helps in resource allocation, ensuring that maintenance personnel are deployed effectively, thereby saving time and labor costs.
Visual KPI is Real-Time Dashboarding, KPI, analytics and alerting software that is changing the way organizations monitor and manage performance. With Visual KPI, companies now have real-time visibility into critical metrics and transform raw data into obvious and actionable KPIs to stay ahead of potential issues. Whether you’re tracking operations, financial data, or energy usage, this solution brings all your key indicators into one dynamic, customizable dashboard. Visual KPI is designed to leverage your existing investments in data platforms and applications (without a large project), and it works on any device to ensure that decision-makers can access the most relevant information anytime, anywhere. It is the ultimate tool for enhancing operational efficiency, reducing downtime, and confidently driving informed, strategic decisions.
Infrastructure Investor Global Summit On-Demand Webcast
Transpara's Robert Hylton featured with Digital Colony, HIG Capital, and Cordiant Capital to discuss how digital infrastructure is faring in the Covid-19 era, what opportunities it presents, and the challenges that come along with being deemed an essential service. View the webcast here: https://www.infrastructureinvestor.com/webcast-covid-19-proves-digital-infra-mission-critical/ (registration required)
For more information on Transpara's Covid-19 public data tracker and dashboards, visit http://transpara.com/covid19.
Back again with a tip for our current users. We’ve heard this request fairly often so here’s a post detailing the migration steps for everyone’s benefit.
Keep the following in mind:
The steps are easy, but the order is critical.
The prerequisites are fundamental and you would not believe how many people ignore them when preparing for a migration. They are not optional. Even though Visual KPI is a modern and quick-to-deploy application, it is still an enterprise-class piece of software and should be treated as such.
For this post, we will assume the typical case, where SQL Server and Visual KPI are on different physical machines. We will also assume that the database and Visual KPI Instance name are identical and are named “InstanceName” for this post. Just replace “InstanceName” with the name of your instance and you will be good to go. This migration guide also works if you are using a local SQLExpress or other local SQL on the same machine as the Visual KPI web server.
Pre-migration checklist (don’t skip this):
If your source system includes any Remote Context Services (RCS), STOP, and Contact us for help with this.
Transpara only supports Domain-joined Servers for installations where SQL and the Visual KPI web server will reside on different machines. We support Workgroup Servers only for installations where SQL and the Visual KPI web server reside on the same machine.
Start with a healthy Visual KPI instance on the source machine. Check the Windows Event Log and correct any errors being thrown by the source Visual KPI instance before attempting the migration.
Locate the installation media for Visual KPI Server Manager which matches the exact version of the source Visual KPI Server.
Once migrated, you can do an upgrade-in-place of the working system. But first, it is essential to get an identical copy running without error.
The Windows OS must be at least Windows Server 2008 R2 on both the source and target SQL and Visual KPI web server machines. However, you can have different OS versions on each machine.
Target Visual KPI web server must have all Visual KPI prerequisites installed and tested (review prerequisites here).
IIS must be configured to allow .NET 4.0 (or newer) to run on the target web server
Both target SQL and target web servers are patched and up-to-date for their OS version
The SQL software on the target machine is either the same as the source machine or newer.
Note: This is a SQL requirement, not a Visual KPI requirement. SQL backups cannot be restored to older versions of SQL than the version on which they are created.
If your SQL environment doesn’t match these assumptions, Contact us for help with this.
Note: make sure you have the necessary permissions before you begin, as there will be frustration and perplexion in your future if you do not. Don’t take this for granted, as we often hear that “IT told me I had rights” when this was almost true, but not quite. Test your true rights by using SQL management studio to create a database called “test” and then delete this database. If both of these steps occur without error, then you have sufficient rights on SQL Server. On the Visual KPI web server, ensure that you are a local Administrator.
Steps to Migrate Visual KPI to a new server:
Now that we have the pre-flight stuff out of the way, the actual migration should take no more than 10 minutes (plus some time to duplicate interfaces if you have lot of them):
On the source SQL Server:
Use SQL Server Backup to create a .BAK file. In our example, you will create “InstanceName.BAK” and containing the database “InstanceName”
Copy the BAK file to the target SQL Server machine
On the target SQL Server:
Restore the database using SQL Restore function
Now you have a database on the target SQL box called “InstanceName.”
In SQL Management Studio, grant dbo rights on this database to the following logins:
NT AUTHORITY\NETWORK SERVICE (if SQl and web are on same machine)
YourDomainName\YourWebServerWindowsMachineName$ (if SQL and web are on different machines)
Replace “YourDomainName” with, guess what? Your actual domain name
Replace YourWebServerWindowsMachineName with the NetBEUI name of the machine which is to run the Visual KPI web server.
Run the Visual KPI Server Manager on the target Visual KPI machine and create a new website instance named “InstanceName”
Uncheck the box to include demo data.
When the database creation step arrives, choose a DB name of “InstanceName-deleteme” where InstanceName is your source system Visual KPI Instance Name.
Keep all other selections named “InstanceName”
Let the wizard run to completion
Create all Interfaces to data sources (OSIsoft PI System, Oracle, Weather JSON, Excel, etc.) with exactly the same names.
For ODBC, OLEDB and other SQL query-based interfaces, copy the *.SQL fields that hold the Current Value, Historical Value, Trend and Historical Data (if present) data queries to their folders in the target Visual KPI machine, overwriting the default files created when the interfaces were installed on the target Visual KPI machine.
For JSON, XML and other REST-based interfaces, copy the web.config from the source machine to the target machine, overwriting the files created when the interfaces were installed on the target Visual KPI machine.
Modify connection strings in the 5 applications, change “DB=InstanceName-delete” me to “DB=InstanceName” in